I have been using ArcGIS in my day-to-day work now for about 10 years. It is an amazing piece of software that is capable of so much that even after 10 years of use I am constantly learning something new about it. Despite having used it to plot the archaeology sites in the province for the last 10 years I still occasionally, see something in the site plots that reminds me that these are more than just dots on maps. For example, 2 weeks ago I told you that I was preparing a lecture for a MUN archaeology class. In preparing for the lecture, which was about the Recent Period Tradition of Newfoundland and Labrador, I produced the following maps for the Early and Late Newfoundland and Labrador Recent Period.
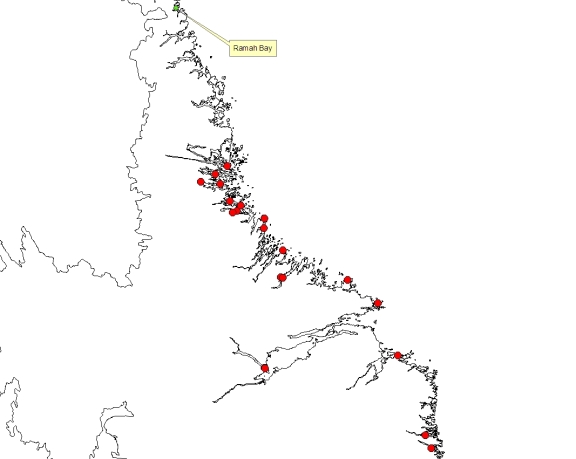
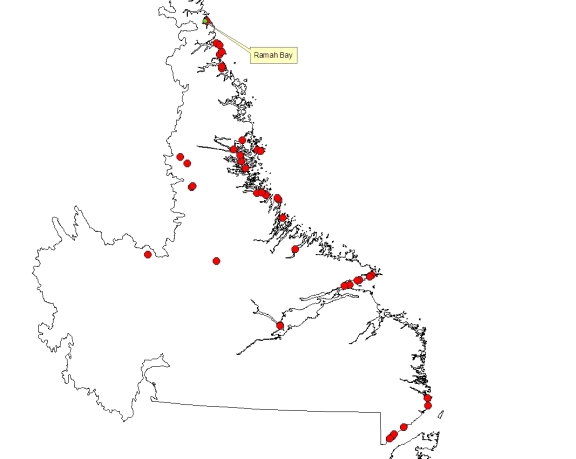
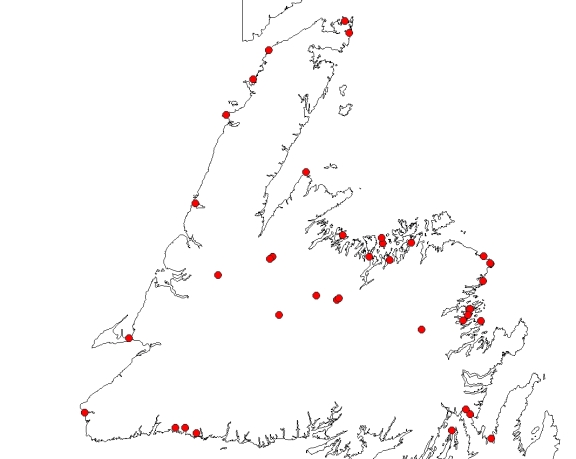
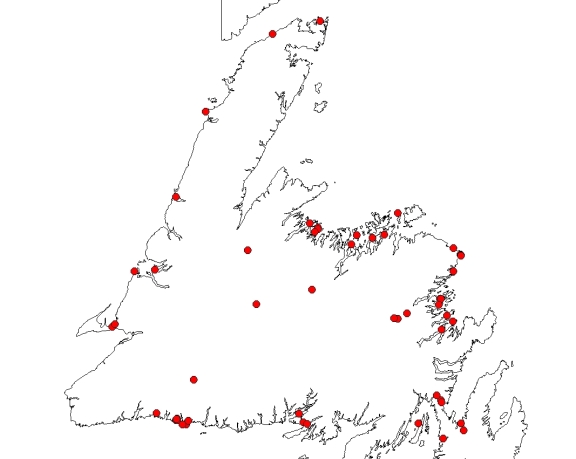
For the most part, I think these maps are what you would expect from a group of people who practiced a generalized settlement subsistence economy. You can see the use of various environments including coastal resources, interior resources and use the resources that are on exposed headlands, islands and the bottoms of sheltered bays. However, what intrigued me about these maps was on the Early Labrador Recent Period map, or rather what was lacking on the map. It appears that they made little to no use of the interior.
Based on radiocarbon dates it appears that the Early Labrador Recent Period may be ancestral to the Early Newfoundland Recent Period. Current dates suggest the Early Lab Recent Period came into existence ~1900 BP and the Early Newfoundland Recent Period came into existence slightly later around the same time ~1800 BP or even 1900 BP if we accept early dates from the sites of Cape Cove 2 & Cape Cove 3 (dates that were initially rejected by the excavators). If we don’t accept those dates the Early Newfoundland Recent Period started ~1500 or 1600 BP.
Therefore, we have a reasonably good idea of when they came into existence but I don’t think we know for sure where people of the Recent Period came from. Several archaeologists have suggested that the Labrador Recent Period is the result of an in situ evolution from some part of the Intermediate Period. The Early Labrador Recent Period map above seems to point to the same conclusion. If the Labrador Recent Period were the result of a new group of people moving into the area after the demise of the Intermediate Period, I would expect that some Early Labrador Recent Period sites would be found to the west or possibly along the south coast. Of course, all of this could simply be the result of more survey work on the coast than in the interior. However, I would think that at least one Early Labrador Recent Period site would have been found in the interior by now if they existed there.
Another gap I noticed is during the Dorset Pre-Inuit period. I can’t take credit for this one, other archaeologists have pointed it out before. Nevertheless, when the sites are displayed in ArcGIS it is very interesting.

Plotting Early, Middle and Late Dorset on a map shows a huge gap along the central coast of Labrador within the rectangle where there is more than 250 km of coastline (in a straight line). Why does this gap exist? Even when we add the other Dorset sites that are not recognized as Early, Middle, and Late, the gap still exists. All we add are eight sites along the southern periphery of the rectangle.
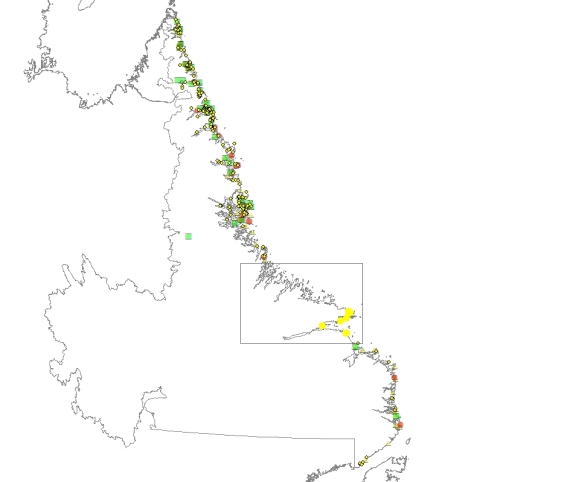
To explain this gap archaeologists theorize that precontact Indigenous groups occupied this area. Those precontact Indigenous groups would be late Intermediate Period and Recent Period in Labrador.
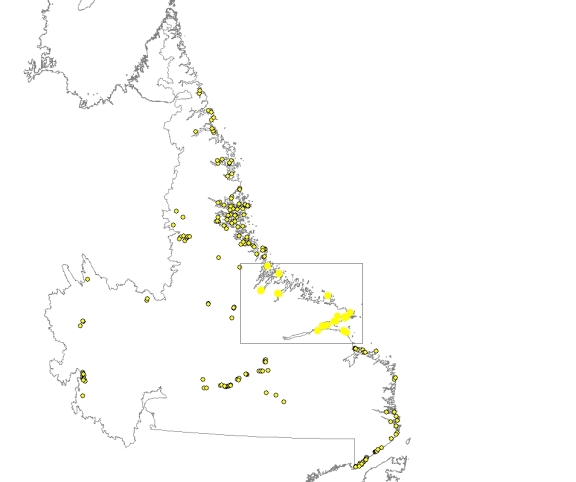
Even when we plot all the Intermediate Period and Recent Period sites, the gap still appears to exist. Just 33 sites fill in the rectangle that takes up nearly 250km of coastline. Granted, a gap is not as evident as in the case of the Dorset sites but the gap is still there. The other side of the argument that ‘The Dorset avoided the area because there were precontact Indigenous groups there is that outside the rectangle the Dorset and precontact Indigenous sites are mixed with one another. Why would they just avoid that rectangle?
There has to be something else that causes this gap. We cannot claim it is due to a lack of research in the area. A map of all known archaeology sites in the province fills in the gap with 289 sites.
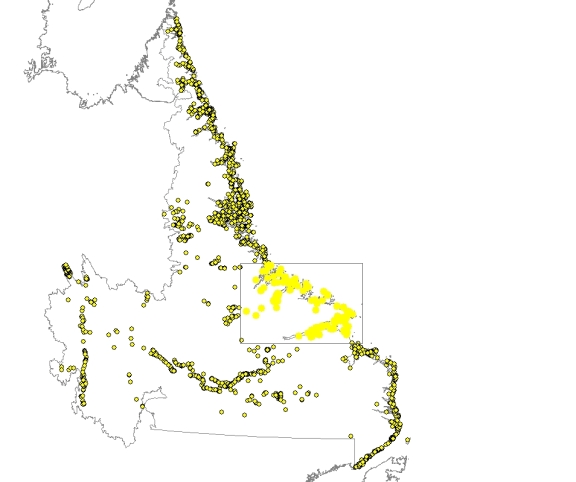
Can you see any other patterns or gaps? For more maps of archaeology sites in Newfoundland and Labrador, you can go here.
Lots to think about, again. Could the preponderance of coastal sites during the Early Labrador Recent Indian time period indicate that people were moving into the area along a coastal route and not populating the interior until after they’d been in the area for a while? Maybe they had to wait for some Intermediate groups to leave?
Excellent, part of the reason for these posts is to get people thinking.
It’s totally possible they were following a coast route. But if you consider the lack of coastal, Straits shore sites then that theory doesn’t really work. Add to that that the earliest Early Labrador Recent Period site is near the northern end of all the Early Labrador Recent Period sites then the coastal idea, based on the data we have now, just doesn’t float. Pardon the pun.
Great post. I love these ArcGIS maps, these visual representations really make you think in a different way about things.
I am glad you like them. Being a visual person myself I really appreciate seeing these site plots. I’ve known about the Dorset gap for years but it wasn’t until I saw the maps that I really appreciated the size of it. And then I plotted the II & RI which I think puts a wrench in the whole theory.
I worked with ArcGis too for about 5 years. Really love working with it. Digitizing stuff and making maps. Wish I had made a career of it.
It is an impressive piece of software.
I work with ArcGIS as a career and there is so much it can do, and the analysis you can generate from it can take you well beyond the dots on a map. I don’t have much of an opportunity to use it in relation to archaeology, so I just loved seeing this example and the theories about the gap.
ArcGIS is a great program. I’ve seen examples of the software where it was used to control things like street lights and other municipal infrastructure. Using it in conjunction with archaeology has allowed us to really speed up things like land use applications and it has allowed us to see patterns and gaps never seen before.
This is great to see regional data from government inventory used to pose and answer questions. Its a greatly underused resource.
This is of course a type of ‘3D’ GIS, with time being the third dimension. Have you tried making this even more visual by making each plot an image that fades from one dataset to the next as the timeline progresses? Really simple to do using, for instance, Windows MovieMaker and I think it can help the brain spot patterns easier than comparing images side-by-side.
GIS technology is rapidly making it technically feasible to store data for individual observations, rather than needing dates or cultural attribution to be packaged as attributes of arbitrary ‘sites’ (see my videos just posted on the GIS and Archaeology discussion group – and come to our SAA session next week if interested in more detail). I really sense the change is paradigmatic in nature. Perhaps it will make little difference for the kinds of questions posed here if the dots on the map represent ‘sites’ classfied by age, or the radiocarbon dates or diagnostic artifacts themselves. But perhaps some of the attributions might change if you could query/display the individual artifact types/styles used to conclude, for instance, “this is an early Dorset occupation”. I do think our questions and understanding will reach new levels of sophistication with such a change. Implementing such a system, of course, is a whole different complication, especially with trying to incorporate old data, it would seem to be prohibitively expensive.
The government inventory in Newfoundland and Labrador is used a lot by other archaeologists. This blog forum is fun for us in the Provincial Archaeology Office because we don’t get to pose and answer many research questions!
No I have not tried your suggestion with Windows MovieMaker but it sounds rather intriguing. A few colleague have suggested that they would like to see these site plots for culture based on radiocarbon dates – so the earliest Recent Period sites would show up first then, following your idea, fade to the next earliest etc. I like the idea of following the evolution of a culture based on artifact transitions.
For ArcMap analysis do you use the Swipe tool? I’m lucky enough to have a superb GiS analyst, Alyssa, work for me and I was amazed and thrilled wihen she showed me that tool. Its great for not only analysis but compring accuracy details of linework mapping to orthophotos or Lidar imagery (or georeffed arch inventory site maps) . I’ve seen swipe tools even on internet advertising sites now so the use is spreading.
I have used it, not a lot but I have used it. It is really neat. I am an archaeologist (with a geography background) who has learned to use ArcGIS. I am not fortunate enough to have access to a GIS analyst in my department. I suspect I’ll always be learning how to use this software, there is so much that it can do!
Maybe these gaps had a different environment or geography that was not conducive to settlement. Also, there may be coastal erosion which has removed evidence of the settlements.
It’s is certainly possible that there is something geographic/environmental going on for the area.